Welcome back! In Part One, we explored the many benefits of incorporating questionnaires into your SLP evaluations. We discussed how to select, create, and administer these valuable tools. This emphasized the importance of a “compared to peers” perspective for your respondents. Now, let’s dive into the crucial next step. Mastering questionnaire reporting and interpretation will make sense of the information you’ve gathered and present it effectively in your reports.
Picture This: The Power of Visual Data

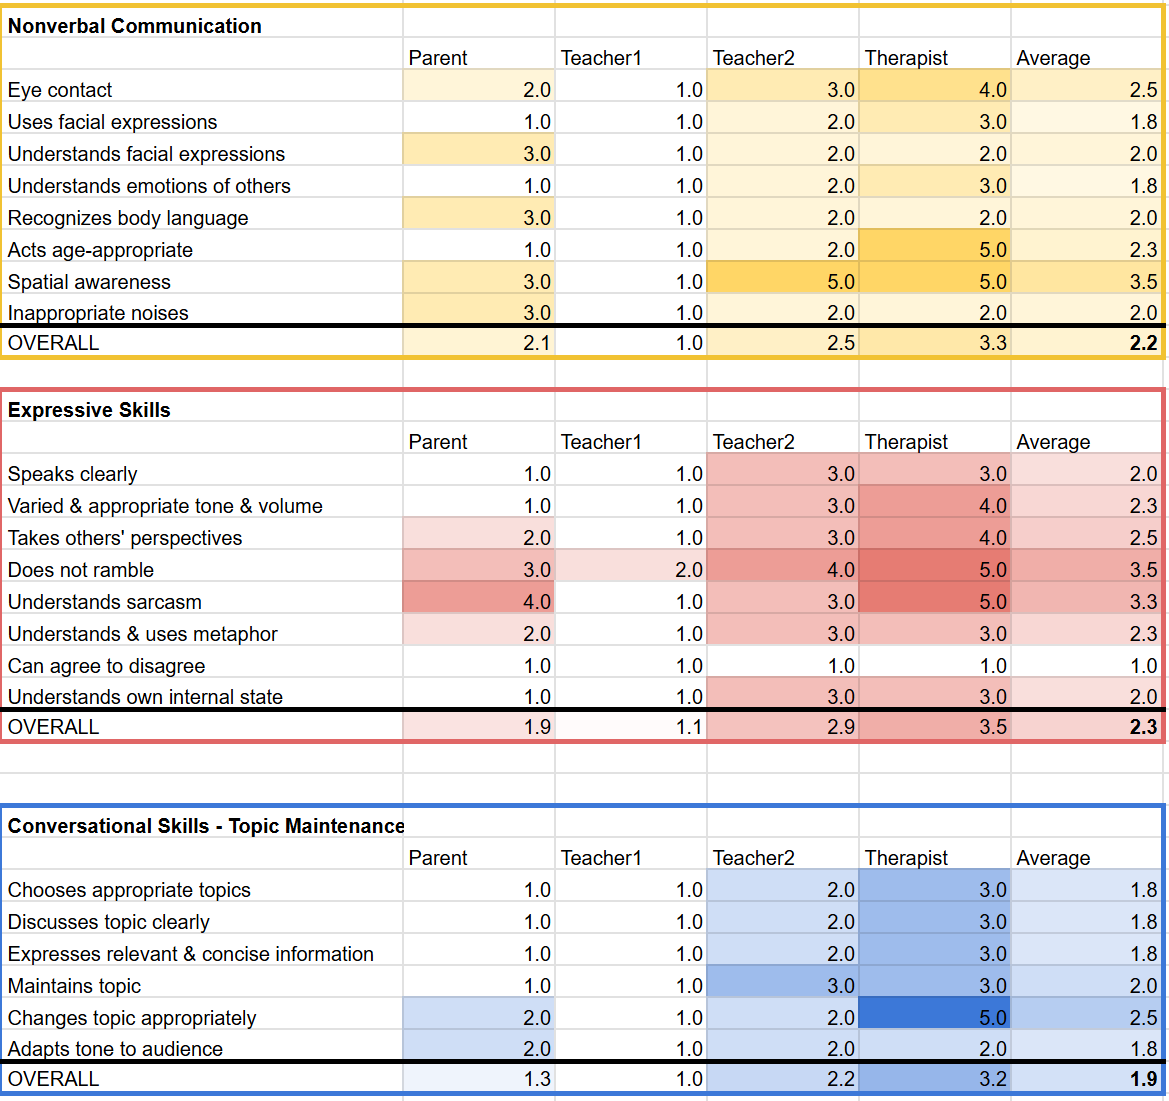
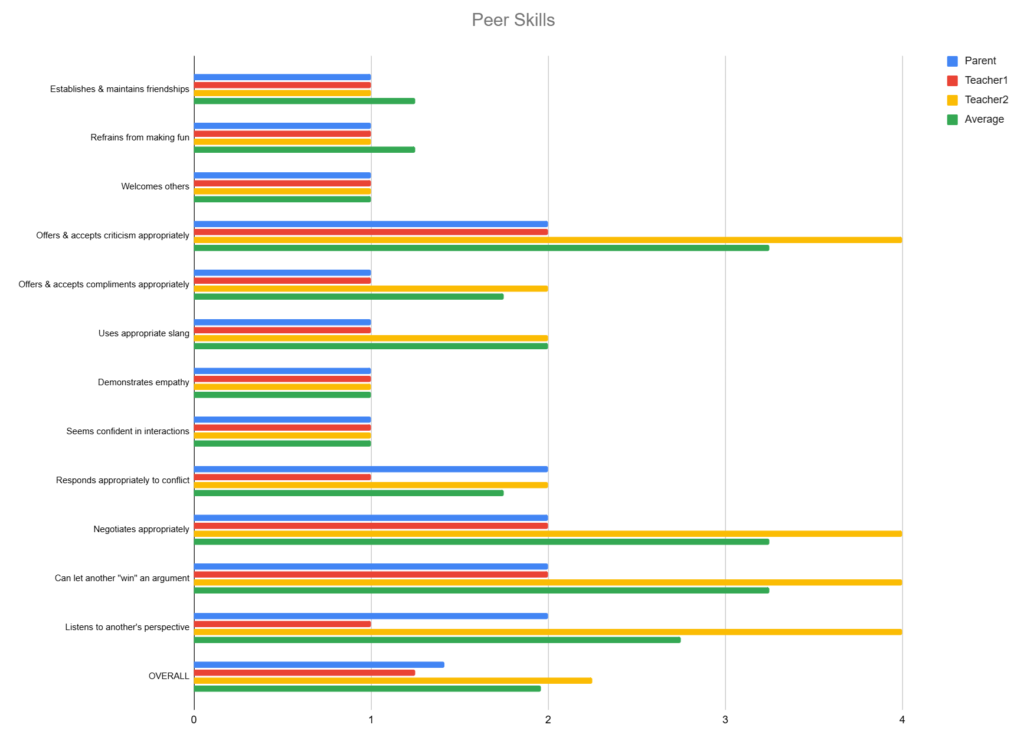
Once you’ve gathered all that valuable questionnaire data, how do you make sense of it and present it effectively? Enter the magic of graphs in questionnaire interpretation! Creating clear, color-coded graphs, like the example from Orion’s, can be a game-changer for your reports.
Think about it: a well-designed graph can instantly highlight patterns and differences in responses across different raters, as well as across skills. When creating your graphs, aim for enough detail so that someone else looking at it could draw similar conclusions to yours. And don’t forget the most crucial part. Always include a written explanation of the data in your report to provide context and your interpretation.
The Value of Multiple Reporters
When you have responses from multiple people, graphing individual skill ratings and calculating averages by respondent and setting can reveal fascinating patterns. For example, in the area of Peer Skills, we might see that while the overall average suggests mild concerns, specific skills like offering and accepting criticism are rated as areas of moderate concern. Furthermore, comparing the average ratings from home versus school might show discrepancies. This could potentially highlight the impact of environmental demands.

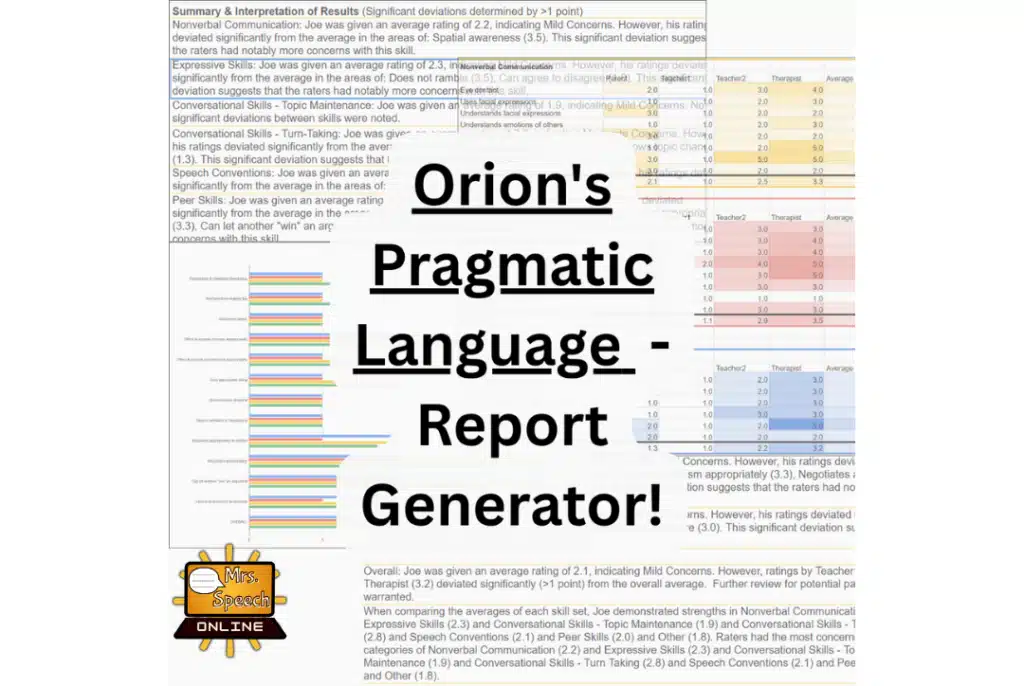
For those using the Orion’s Pragmatic Language Skills Questionnaire, this process can be significantly streamlined. A companion Google Drive report and charting tool is now available. It automates the report writing process and generates visual comparisons of scores. This tool transforms raw data into comprehensive, insightful reports with illustrative charts in as little as 15 minutes. It saves you valuable time and effort. See my FREE fillable Orion’s form.
Examples
- Overall, respondents had mild to moderate concerns for {FirstName}’s use of pragmatic language skills.
- {FirstName} appears to have an easier time with pragmatic language at home. The home rating was an average of 1.5, and XX and YY rated an average of 1.8 and 2.6, respectively. This is likely due to the lower demands of the home environment versus the school environment.
- Furthermore, her performance with YY might be impacted due to her low preference for the subject.
- However, most of the areas that were of the most concern are higher level social language skills. These skills are still developing at 6 years of age and involve maturing concepts such as understanding perspectives, conversational nuances, multiple or non-literal interpretations, and abstract thought. These higher level skills typically show a wide range of development at this age, and are highly dependent on context-rich exposure, practice, and reinforcement. Situational based discussions, targeted skill playgroups and review of challenging situations to problem-solve them are recommended to continue development in these areas.
Decoding the Differences

One of the coolest things about using questionnaires with multiple respondents (like parents and teachers) is that you might see some differences in their ratings. Instead of viewing this as a problem, see it as an opportunity for deeper understanding! These discrepancies can reflect the different demands and expectations of various settings, which can be uncovered with effective questionnaire interpretation.
Don’t hesitate to reach out to respondents to discuss their ratings. You could ask for specific examples of why they rated a skill a certain way. Or explore the reasons behind differing opinions. Maybe the child’s communication skills fluctuate depending on the time of day, the specific setting, or the people they’re interacting with. These conversations can provide invaluable qualitative data to complement your quantitative findings. They offer deeper insights into the ‘why’ behind the ratings.
Don’t forget that things like culture, time of day, medications, and comfort level in setting can play a huge role in the ratings, as well!
Conclusion
By thoughtfully presenting the data you’ve gathered from questionnaires, especially through clear visuals and detailed explanations, you can paint a much richer picture of your students’ communication abilities across various settings. Understanding and interpreting the nuances in responses from different individuals, through effective questionnaire reporting, provides invaluable insights. These insights can directly inform your goals and recommendations. Embracing the power of questionnaires in this way truly elevates your evaluations and ultimately benefits the students we serve.
Update!
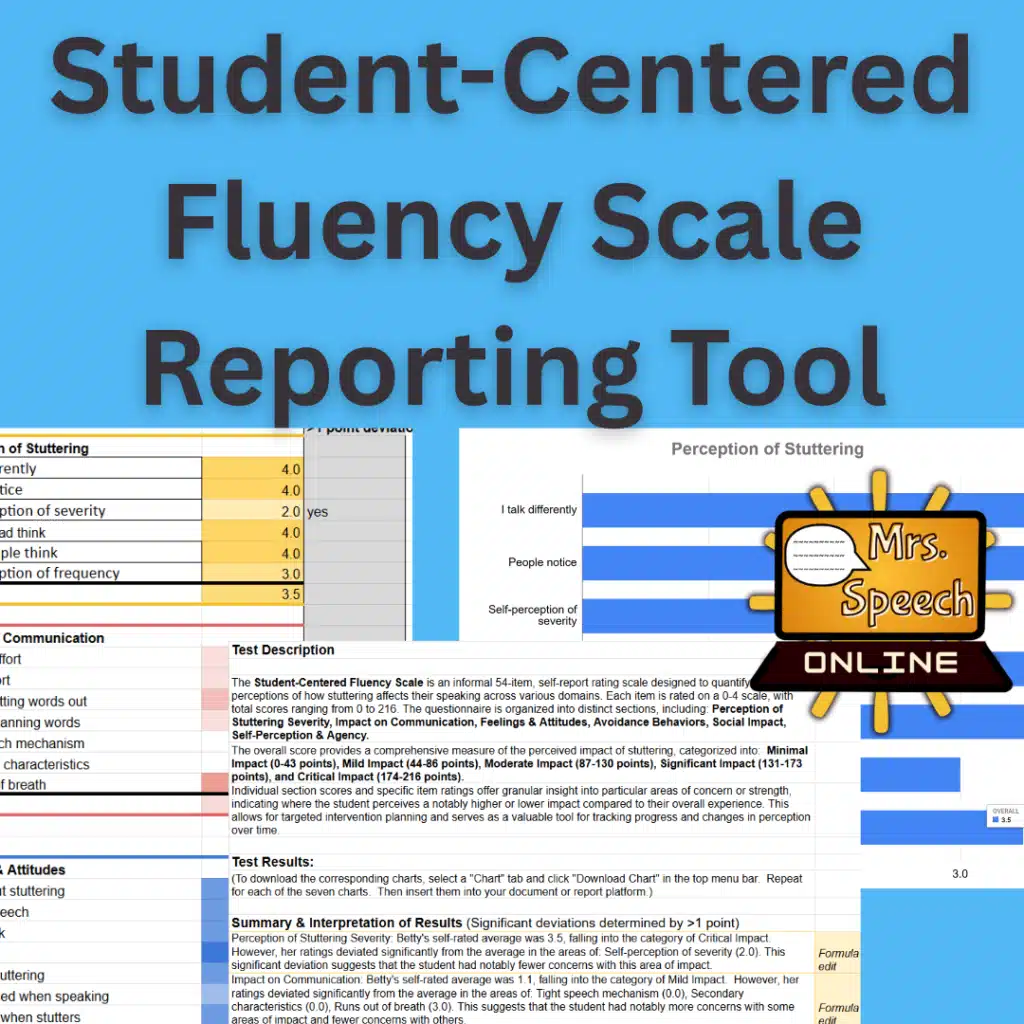
I‘ve created Reporting Tools for my popular Student-Centered Fluency & Articulation Scales! Designed to save you time and really demonstrate student perceptions and holistic impact of their speech. Find them on TPT!


What are your experiences with reporting questionnaire data? Any other tips you’d add? Let’s continue the conversation in the comments below!
Don’t forget to check out Part 1: Value and Use!
Happy rating!
Social Media Icons: designed by rawpixel.com – Freepik.com


